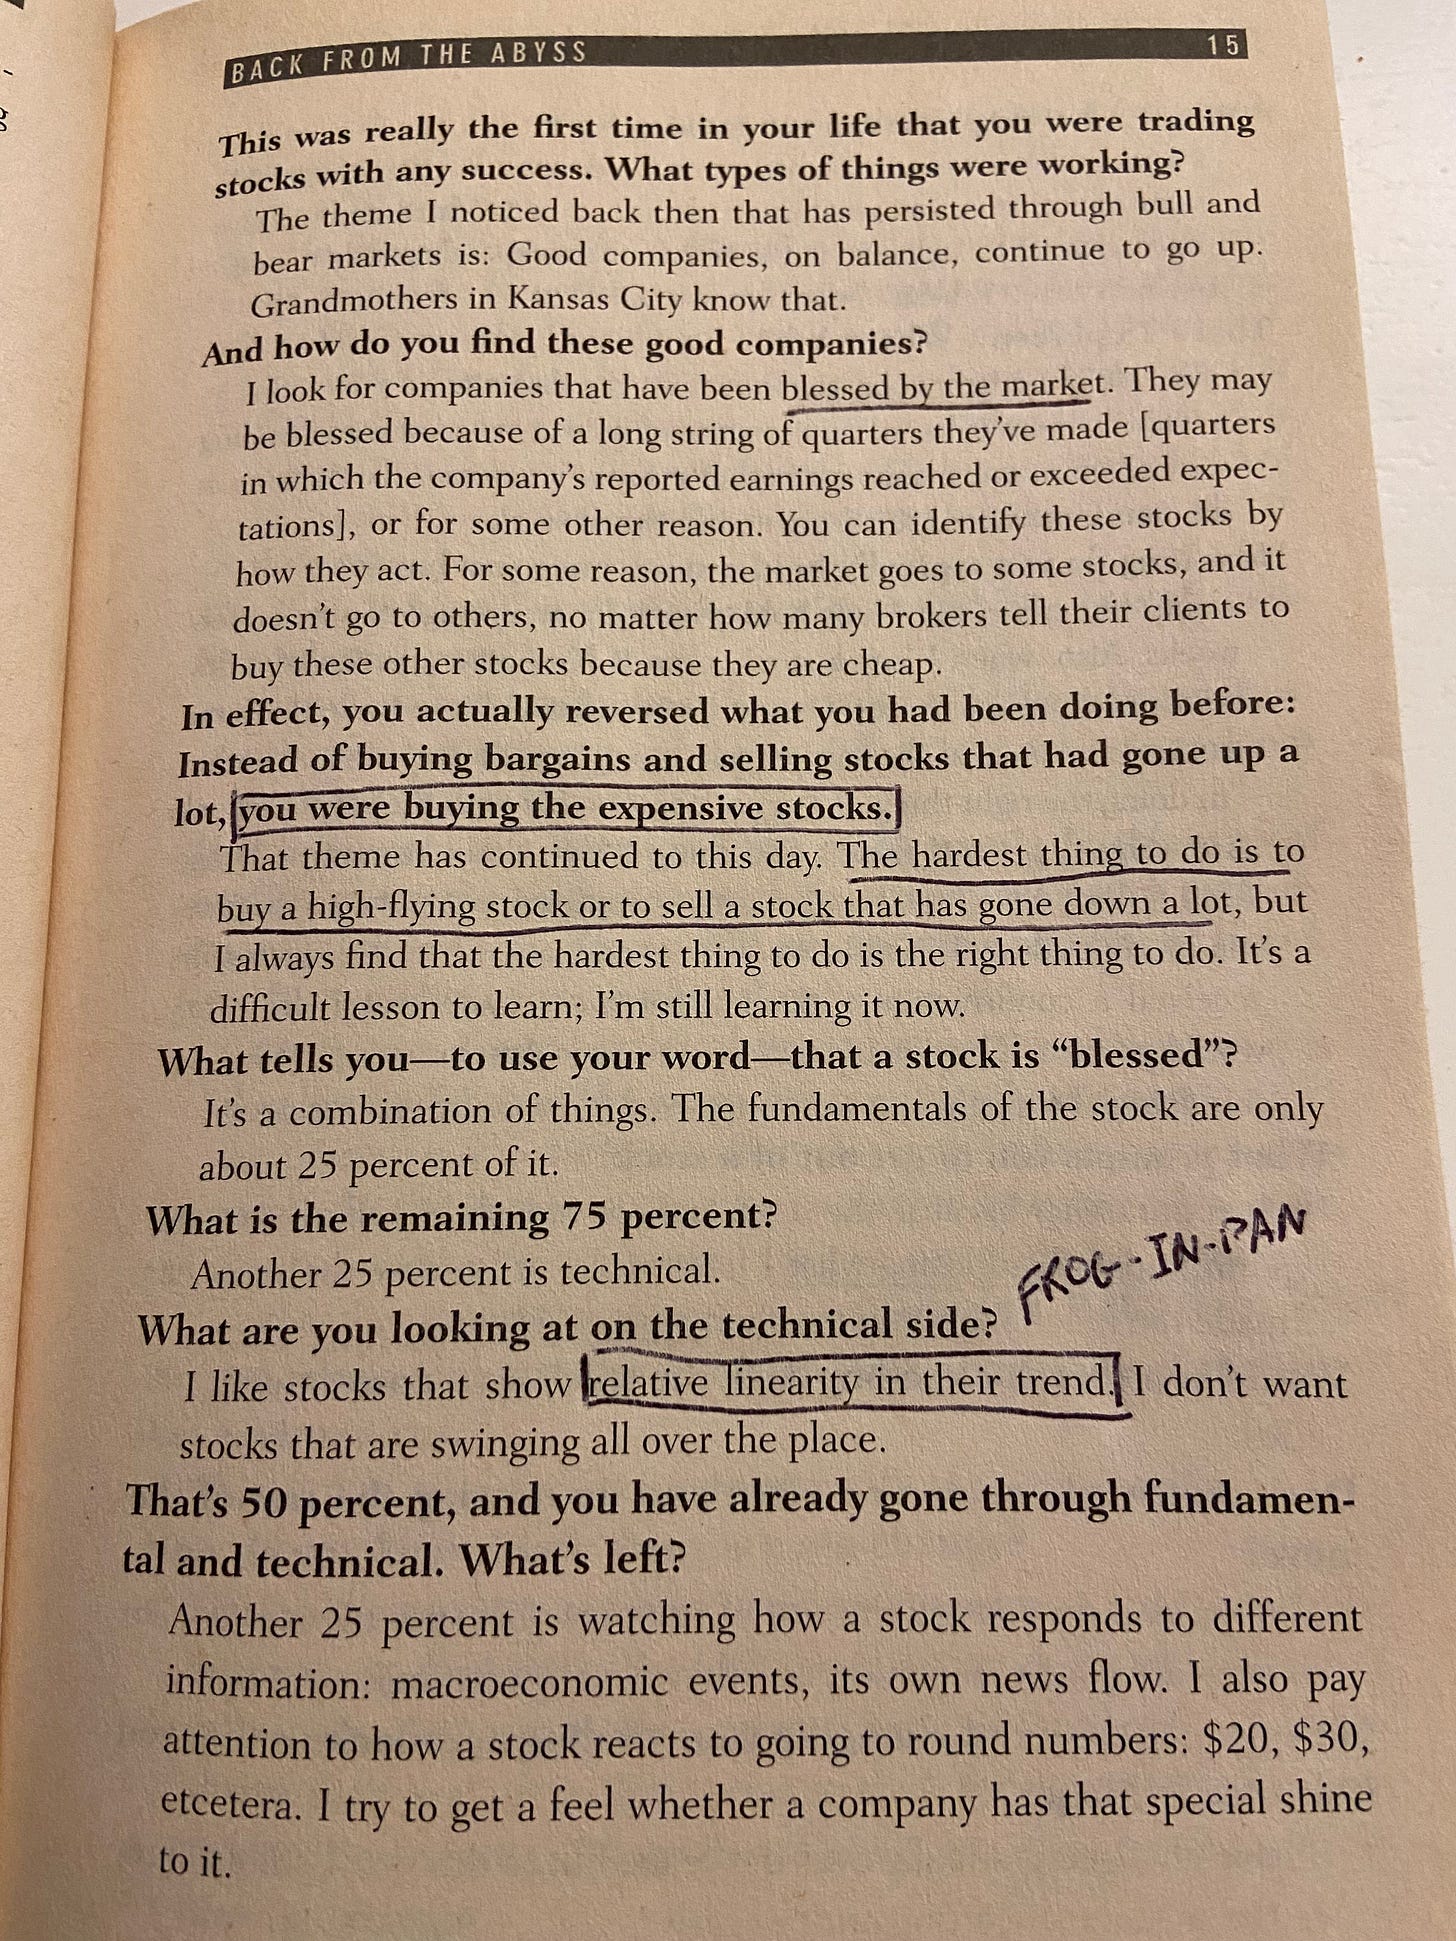
I was re-reading the interview with Stuart Walton in Stock Market Wizards and I read a line that I hadn’t really noticed before:
What tells you - to use your word - that a stock is “blessed”?
It’s a combination of things. The fundamentals of the stock are only about 25% of it.
What is the remaining 75 percent?
Another 25 percent is technical.
What are you looking at on the technical side?
I like stocks that show relative linearity in their trend. I don’t want stocks that are swinging all over the place.
“Relative linearity in their trend.”
That was the line that I hadn’t really noticed before. The reason that it stood out to me this time was probably because I had just recently finished Wes Gray and Jack Vogel’s Quantitative Momentum and in it, they had introduced the idea of the Frog-in-the-pan (FIP) hypothesis, which is the idea that “a series of frequent gradual changes attracts less attention than infrequent dramatic changes. Investors therefore underreact to continuous information.”
“The boiling frog is an apologue describing a frog being slowly boiled alive. The premise is that if a frog is put suddenly into boiling water, it will jump out, but if the frog is put in tepid water which is then brought to a boil slowly, it will not perceive the danger and will be cooked to death. The story is often used as a metaphor for the inability or unwillingness of people to react to or be aware of sinister threats that arise gradually rather than suddenly.” - Wikipedia (Boiling frog)
Tl;DR: If you want to skip the rest of the post, the drawing below by Wes pretty much sums up the idea:
In a 2012 paper, the researchers tested the idea of continuous momentum (high-quality) and discrete momentum (low-quality):
We test a frog-in-the-pan (FIP) hypothesis that predicts investors are inattentive to information arriving continuously in small amounts. Intuitively, we hypothesize that a series of frequent gradual changes attracts less attention than infrequent dramatic changes. Consistent with the FIP hypothesis, we find that continuous information induces strong persistent return continuation that does not reverse in the long run.
Momentum decreases monotonically from 5.94% for stocks with continuous information during their formation period to –2.07% for stocks with discrete information but similar cumulative formation period returns. Higher media coverage coincides with discrete information and mitigates the stronger momentum following continuous information.
The measure they constructed was the following:
In short, they measured the percentage of positive days and negative days during a time period, found the difference, and multiplied the difference by the sign of the overall return of the time period: a larger number meant that the momentum was more discrete/low-quality (smaller meant is was more continuous/high-quality).
The results are quite fascinating: higher levels of momentum continuity corresponded with higher returns.
Main Takeaway: The key idea here is that investors could be well-served to keep in mind how “smooth” the stock returns are, since investors are most likely underreacting to good news.
In short:
Avoid stocks that jump around a ton, exhibit lotto-like behavior or only have relatively few up days and
Stick to those that are trending more smoothly
Some other interesting ideas that stem from this would be if linearity/smoothness of underlying fundamental data has any impact on excess returns (e.g. linearity of sales, EPS, FCF, etc.). If you have come across any studies, please feel free to send them my way.
One final (and I think interesting) point is that Walton’s interview took place in 1999/2000 - many years before these research papers were released. Coincidentally, as I was finishing up this post, I came across a tweet and subsequent comment that I thought was an apt way to wrap things up:


